Using JaCoCo merge goal to report coverage in multi-module projects

This Example github project shows how jacoco:merge goal can be used to merge all the exec files

In this example we two projects.  project1 and project2

  • project1 has 2 classes : Example1 and Example2. It also has 1 unit test to fully cover Example1
  • project2 has only unit test. The unit test fully covers Example2 from project1

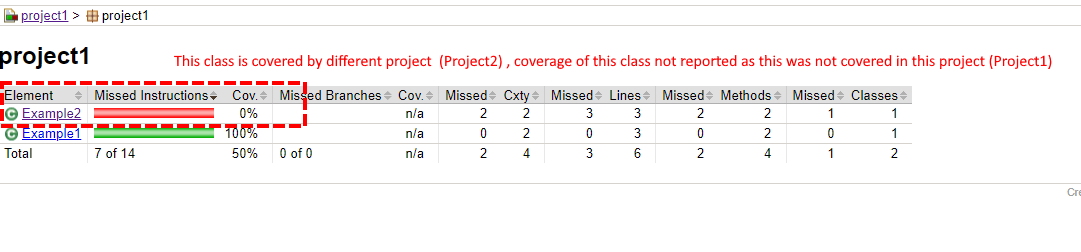
As project1 is not covering Example2, jacoco will report 0% coverage for Example2

Firstly, to show that JaCoCo will show 0% coverage for Example2 class in project1 run these commands:


mvn clean verify

then run


mvn jacoco:report

if you go into folder

project1/target/site/jacoco/project1 you’ll the reports produced by jacoco

The report shows class Example1 has 100% coverage whilst Example2 (which is covered by project2) has 0% coverage

Using merge goal to get JaCoCo to report on coverage provided by other projects

For the above example, we want to show Example2 is fully covered (as coverage was provided by project2)

To get jacoco to report coverage provided by other projects. We need to merge all the jacoco.exec files we have

  • project1 jacoco exec is under project1/target/jacoco.exec
  • project2 jacoco exec is under project2/target/jacoco.exec

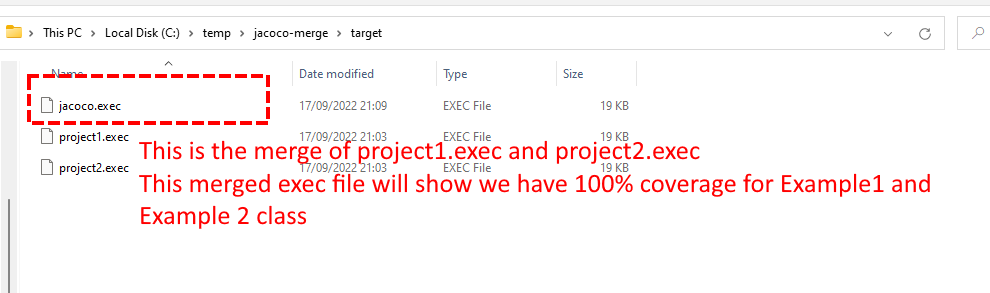
Merge the jacoco.exec from project 1 and project 2 to make a merged jacoco.exec The merged jacoco.exec file will show we have 100% coverage for Example2 class. We will then configure the reporting goal to use this merged exec file.

Step 1

We want to copy all the jacoco.exec file into the top level folder target folder (we may also need to create the target folder)

we need to copy all jacoco.exec we have into the top-level target folder, but so that they don’t overwrite each other, we need to give them unique names, for this we will use merge goal (or you can use copy script for this step)

Note: jacoco:merge goal requires fileSets config to be present see : merge goal documentation

We will add this to our the jacoco plugin configuration (so that we can use the merge goal)

<fileSets>
  <fileSet>
    <directory>${project.build.directory}</directory>
    <includes>
      <include>*.exec</include>
    </includes>
  </fileSet>
</fileSets>

as mentioned, the file(s) when written to the top level, we don’t want them to overwrite to each other, so we give them file name :  

${project.artifactId}.exec

E.g. on Windows if the project level folder was : c:/temp/jacoco-merge

You would run this (making sure that c:/temp/jacoco-merge/target) exists first


mvn jacoco:merge -Djacoco.destFile=c:/temp/jacoco-merge/target/${project.artifactId}.exec

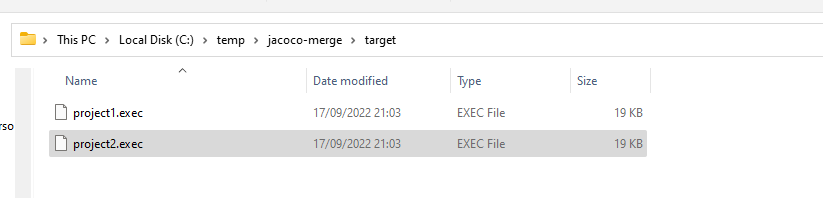
End result should look like this (strictly speaking, you could use copy commands to achieve this instead)

Step 2

Now that we have all the exec files (project1.exec and project2.exec) in one folder, we need to merge these 2 files to produce merged jacoco.exec file

For this, we run this command. NOTE: Since all the files are all in the top level folder, we only need to execute merge goal at the top level folder only so we use flag -N to not recurse this merge goal in the child projects.


mvn -N jacoco:merge

Result of above

Step 3

Now that we have the merged exec file produced in above step. What we want to do is run the report goal (to generate the html reports) but instead the of using default jacoco.dataFile value (${project.build.directory}/jacoco.exec) we will configure jacoco.dataFile to instead use the merged jacoco exe file


mvn jacoco:report -Djacoco.dataFile=C:\temp\jacoco-merge\target\jacoco.exec

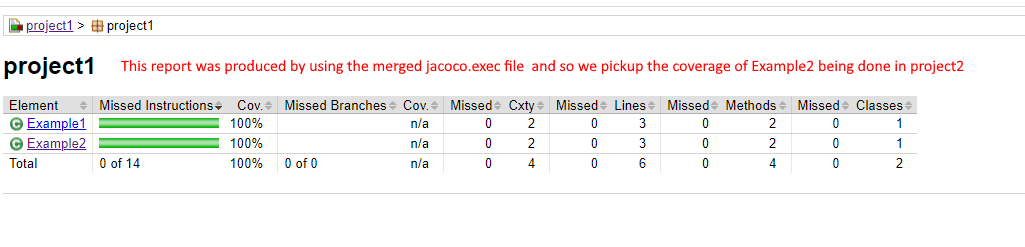
Now if we look again in project1/target/site/jacoco/project1 we can see it shows both Example1 and Example2 have 100% coverage

Experimenting with Java Valhalla

The vallhalla project will hopefully bring lower cost objects (at the expense of giving up Object Identity and/or nullability)

Shipilev provides daily Valhalla builds, you can download from here :

Wanted to compare the difference in memory / speed of using the value and primitive types. Here is simple test program I used.

As Regular Object (With Identity and Nullability)

public class Main {

    // Ensure you are using the valhalla jdk build
    // run with this command :
    // javac -XDenablePrimitiveClasses  Main.java
    // then 
    // java -XX:+EnablePrimitiveClasses Main

    static public class Point {
        private final double x ;
        private final double y ;

        public Point(double x, double y) {
            this.x = x;
            this.y = y;
        }
    }

    public static void main(String[] args) {

        long start = System.currentTimeMillis();

        Point[] myArray = new Point[10_000_000];
        for (int i = 0; i < myArray.length; i++) {
            myArray[i]=new Point(2d,3d);
        }

        Runtime.getRuntime().gc();

        printMemoryUsage();

        System.out.println("Array length : "+myArray.length);

        System.out.println("Total time "+(System.currentTimeMillis() - start)+ " ms");

    }

    private static void printMemoryUsage() {
        System.out.println("MB: " + (double) (Runtime.getRuntime().totalMemory() - Runtime.getRuntime().freeMemory()) / (1024*1024));
    }

}

If I run this above example (using regular java objects) these are the numbers I’m getting

java Main.java

MB: 346.2878112792969
Array length : 10000000
Total time 250 ms

Now if we change the above Point class by making a primitive class (giving up Identity and Nullability) . To make it easy to do this, they have provided temporary keywords

primitive to declare the class as primitive type (giving up identity and nullability)

value to declare the class as value type (giving up identity)

As Primitive Type

public class Main {

    // Ensure you are using the valhalla jdk build
    // run with this command :
    // javac -XDenablePrimitiveClasses  Main.java
    // then 
    // java -XX:+EnablePrimitiveClasses Main

    static public primitive class Point {
        private final double x ;
        private final double y ;

        public Point(double x, double y) {
            this.x = x;
            this.y = y;
        }
    }

    public static void main(String[] args) {

        long start = System.currentTimeMillis();

        Point[] myArray = new Point[10_000_000];
        for (int i = 0; i < myArray.length; i++) {
            myArray[i]=new Point(2d,3d);
        }

        Runtime.getRuntime().gc();

        printMemoryUsage();

        System.out.println("Array length : "+myArray.length);

        System.out.println("Total time "+(System.currentTimeMillis() - start)+ " ms");

    }

    private static void printMemoryUsage() {
        System.out.println("MB: " + (double) (Runtime.getRuntime().totalMemory() - Runtime.getRuntime().freeMemory()) / (1024*1024));
    }

}

This are the results if Point is primitive class

java Main.java

MB: 158.47823333740234
Array length : 10000000
Total time 72 ms

By turning the Point class into primitive class, it uses less than half the memory and it is 3x faster

As Value Type ( using “value” instead)

MB: 347.8201599121094
Array length : 10000000
Total time 224 ms

Declaring class as value type didn’t yield any memory saving, but did make code run slightly faster.

Heap Dump

To get a heap dump of an existing application you need to know the PID of your java process.

To do this, you can use the jps command

jps -l

So for above, I can see the PID for the process is 5776

Once you know your PID you can use the jcmd to generate the heap dump

jcmd <pid> GC.heap_dump <file-path>

For above PID I can do


jcmd 5776 GC.heap_dump c:/temp/dump.hprof

To open the the heap dump, you can use YourKit or Open source tools such as Eclipse MAT tool

Using Eclipse MAT Tool we can open the Heap dump

Using the Eclipse MAT tool you can see the drill in the pie chat to list Objects and to see the incoming references, see the retain size of objects, see the paths to GC Root. MAT tool also has leak hunter tool to try to find problem areas.

Maven Enforcer Plugin

The maven-enforcer-plugin (and it’s various extensions) are really useful if you want to enforce various build rules such as :

  • Make sure the maven build is using minimum required Java and Maven versions.
  • Build is not referring to snapshot dependencies
  • No Duplicate classes in your project dependencies (see screenshot below of what it reports when it finds duplicates)
  • Ban certain imports (e.g. java.util.Vector, java.util.Date etc) being used in your build.

Here is an example project to show above checks in action.

Output of BanDuplicateClasses check if it detects duplicate classes.

Output of RestrictImports if finds usage of Banned Import (example: java.util.Vector).

Debugging Orika Mapper Generated Classes

Orika Mapper is mapping library that generates mapper classes at runtime, because the classes are generated in memory, it can be pain to debug why generated mapping is not working.

Orika has the an option to output source code for the generated classes

To make sure the source code is written to the filesystem you need to run with this system property


-Dma.glasnost.orika.writeSourceFiles=true


See OrikaSystemProperties class for more details about the various properties

Using Error-Prone with NullAway Plugin

Error Prone is static anaylsis tool for Java. It hooks into the compilation process. To use in your maven build you need do some configuration for the maven compiler plugin

An example of error prone being setup for maven compiler plugin with also Null Plugin enabled

<plugin>
<groupId>org.apache.maven.plugins</groupId>
<artifactId>maven-compiler-plugin</artifactId>
<version>3.8.1</version>
<configuration>
<source>8</source>
<target>8</target>
<encoding>UTF-8</encoding>
<fork>true</fork>
<compilerArgs>
<arg>-Werror</arg>
<arg>-Xlint:all</arg>
<arg>-Xlint:-processing</arg>
<arg>-XDcompilePolicy=simple</arg>
<!-- Note the -XepOpt:NullAway:AnnotatedPackages= is mandatory -->
<arg>-Xplugin:ErrorProne -Xep:MissingOverride:ERROR -Xep:NullAway:ERROR -XepOpt:NullAway:AnnotatedPackages=com.choudhury</arg>
<arg>-J--add-exports=jdk.compiler/com.sun.tools.javac.api=ALL-UNNAMED</arg>
<arg>-J--add-exports=jdk.compiler/com.sun.tools.javac.file=ALL-UNNAMED</arg>
<arg>-J--add-exports=jdk.compiler/com.sun.tools.javac.main=ALL-UNNAMED</arg>
<arg>-J--add-exports=jdk.compiler/com.sun.tools.javac.model=ALL-UNNAMED</arg>
<arg>-J--add-exports=jdk.compiler/com.sun.tools.javac.parser=ALL-UNNAMED</arg>
<arg>-J--add-exports=jdk.compiler/com.sun.tools.javac.processing=ALL-UNNAMED</arg>
<arg>-J--add-exports=jdk.compiler/com.sun.tools.javac.tree=ALL-UNNAMED</arg>
<arg>-J--add-exports=jdk.compiler/com.sun.tools.javac.util=ALL-UNNAMED</arg>
<arg>-J--add-opens=jdk.compiler/com.sun.tools.javac.code=ALL-UNNAMED</arg>
<arg>-J--add-opens=jdk.compiler/com.sun.tools.javac.comp=ALL-UNNAMED</arg>
</compilerArgs>
<annotationProcessorPaths>

<path>
<groupId>com.google.errorprone</groupId>
<artifactId>error_prone_core</artifactId>
<version>2.9.0</version>
</path>
<path>
<groupId>com.uber.nullaway</groupId>
<artifactId>nullaway</artifactId>
<version>0.9.2</version>
</path>

</annotationProcessorPaths>
</configuration>
</plugin>

In the above we increased the severity error-prone’s MissingOverride bugpattern to Error (error-prone default was WARNING)

This how the output looks like if now in maven’s compilation goal a class that has a missing @Override annotation

Another feature of error-prone is that it has Intellij Integration
You need to install the https://plugins.jetbrains.com/plugin/7349-error-prone-compiler-integration once that’s done you can change the compiler that Intellij uses

Now within Intellij you will get the same compilation errors as you get from maven

For more details about the installation, see the error-prone documentation http://errorprone.info/docs/installation

Example Maven Project Here